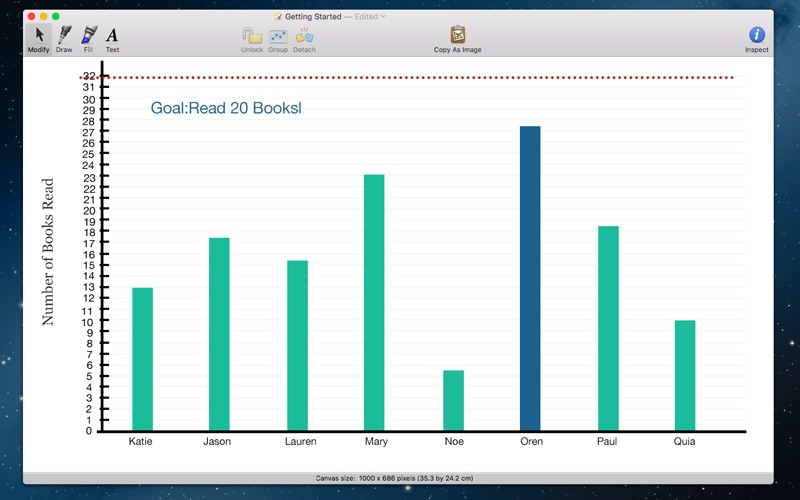


Graphic Studio is unique in that it combines some features of illustration software with some features of data plotting software, so that you can create graphs really, really quickly.
Ordinarily, if you wanted to sketch out a quick graph and have it look passably attractive, you’d need to struggle against a drawing application that has no idea what axes or data sets are. Or, you’d have to do battle with a spreadsheet or mathematics application that makes drawing anything feel like pulling teeth: even if you don’t have specific data to plot, you need to make some up in order to illustrate your concept.
Graphic Studio is a quick, straightforward tool for creating graphs, whether you have specific data to visualize or you just have a concept to explicate. And it doesn’t assume that you have gobs of free time and attention to learn how to use it.
● Drawing Lines and Points with the Draw Tool
- The Draw tool is how you sketch data, in the form of points, on the canvas. To get into Draw mode, just click the Draw button in the toolbar, or hold down the D key (the “hot key” for this tool).
● Drawing Fills with the Fill Tool
- The Fill tool is how you shade or highlight areas of the canvas. To get into Fill mode, just click the Fill button in the toolbar, or hold down the F key (the “hot key” for this tool)..
● Adding Labels with the Text Tool
- The Text tool is how you add labels to the canvas. Text labels can be attached to pretty much anything.
● Attaching and Detaching Objects
- If you draw a point on top of an existing line or point, or drag a point onto another object, the two objects snap together. So, subsequently moving one of the objects will bring the other one along for the ride, unless you detach them.
● Locking and Unlocking Objects
- If you’ve got something in just the right position, you can keep it from getting accidentally moved.
● Grouping and Ungrouping Objects
- Related objects can be grouped together, so that they always become selected and move as a whole. When you select one object in a group, all of the other objects in the group are selected. When you move one member, the rest come with.
● Adjusting the Axes
- The x-axis and y-axis of your graph determine the range of values that are visible. You can adjust their scale to best display your data.
● Importing Data
- Importing numeric data into GraphDraft is pretty straightforward. In many cases, you can just select it from your spreadsheet, outline, or text document, copy it, and then paste it into a graph. If the data is in a text file, it can be comma-separated (CSV) or tab-delimited. Here are some tips for amicable importing.
● Exporting Data
- You can export your graph in a number of image formats, and you can also get your numerical data out.
The easiest way to get your graph as an image is to click the Copy As Image toolbar button or choose Copy Graph as Image from the Edit menu. Then, you can just paste it into another application.
To create an image file of your graph, use the Export command in the File menu and choose the format that meets your needs.(PDF,PNG,JPEG)